The Windsor Way Demo

Real Estate Predictive Performance for Growing Brands

Three Strategic Questions for Growth

What drives location performance?

Where should the brand expand?

Which sites will outperform?

1
Predictive Model
Build Your Location DNA
2
Territory Optimization
Map High-Potential Markets
3
Precision Site Selection
Score & Secure Best Locations

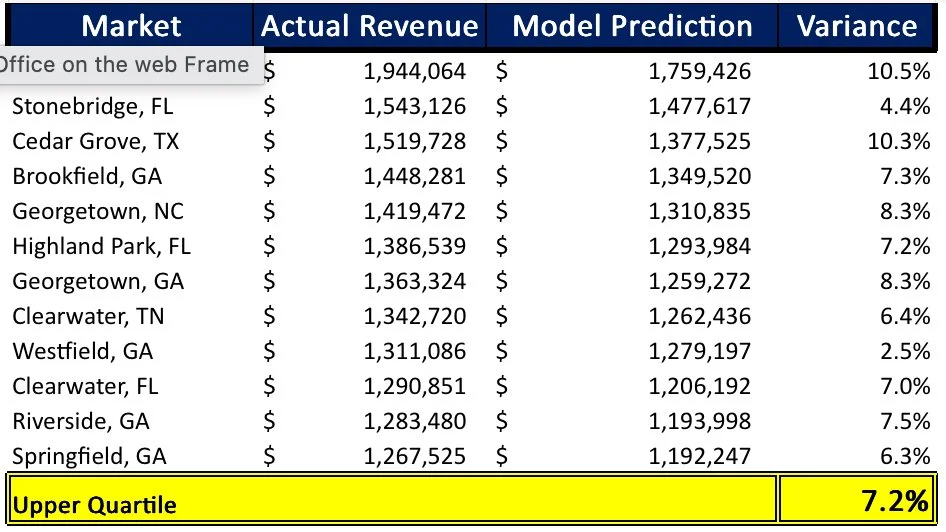
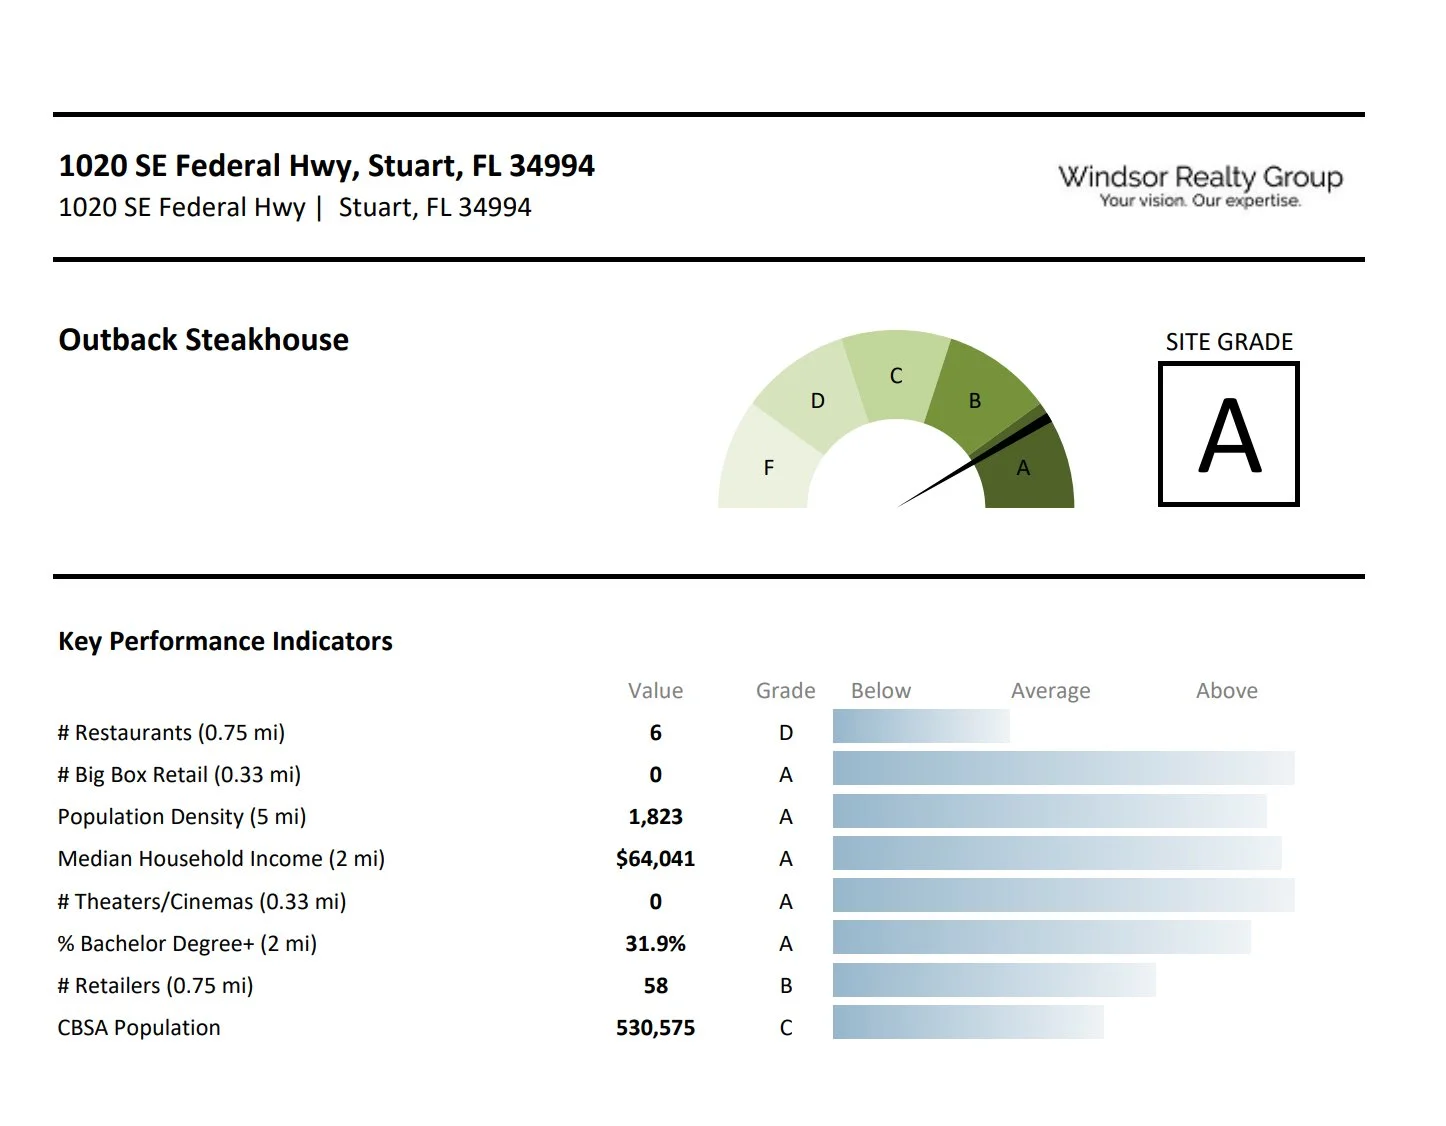
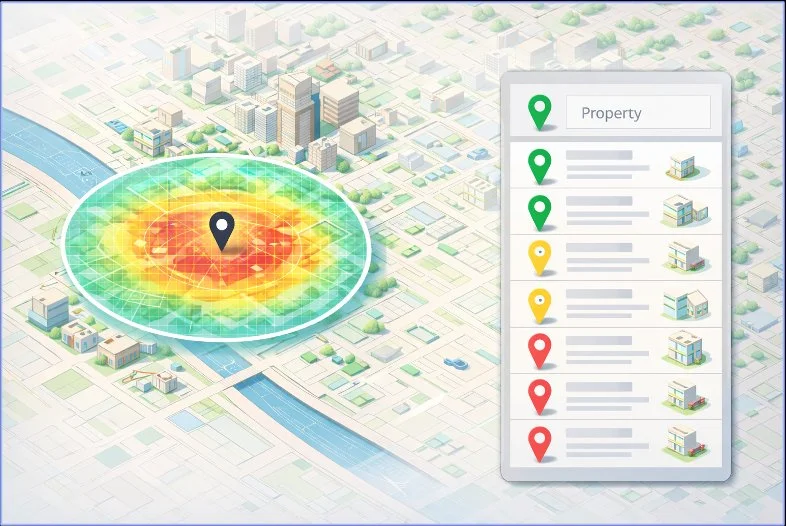
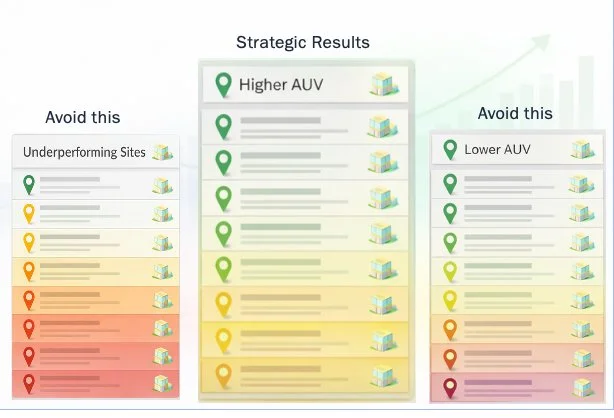
Increase AUV. Eliminate Underperforming Stores.

Every brand has "stars" and "dogs." We model the difference — and make sure your next locations perform like your best.

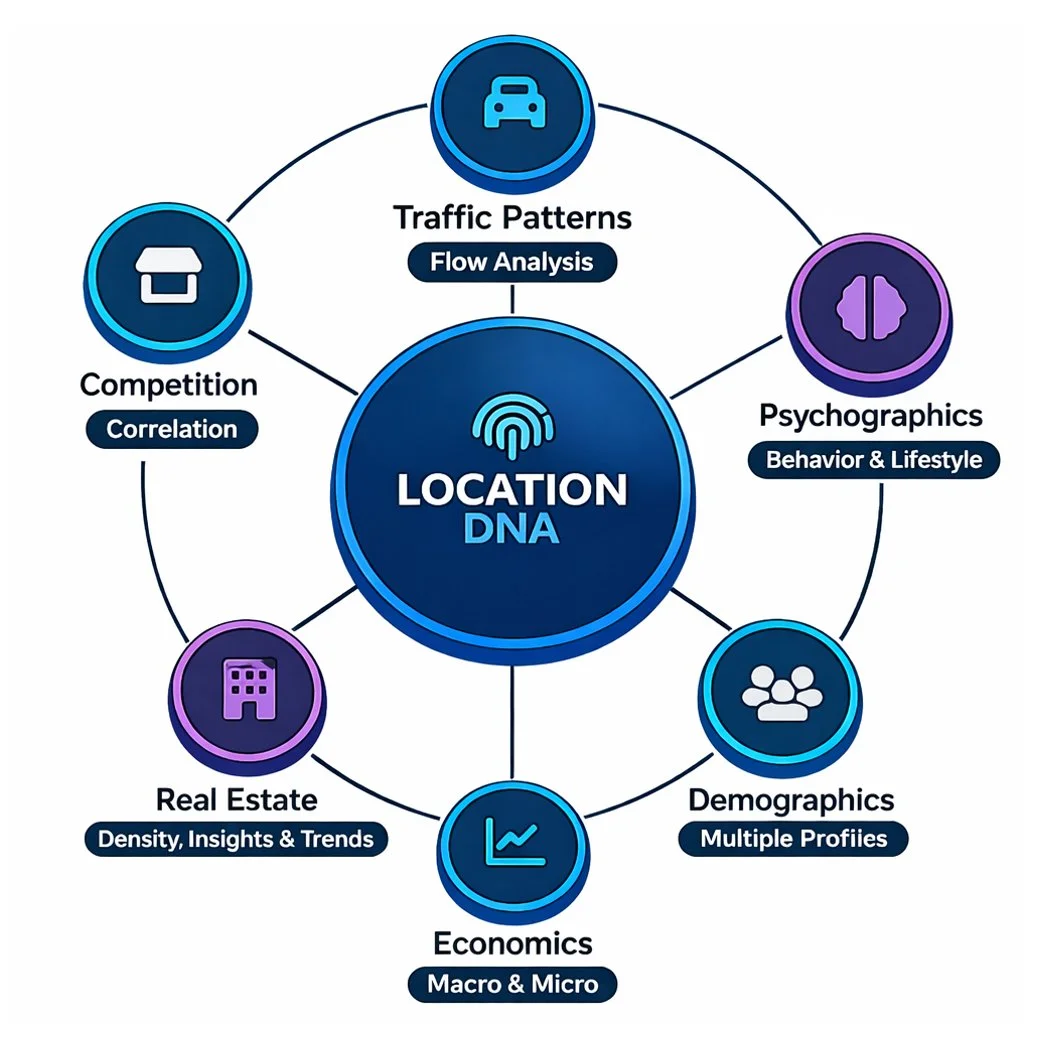
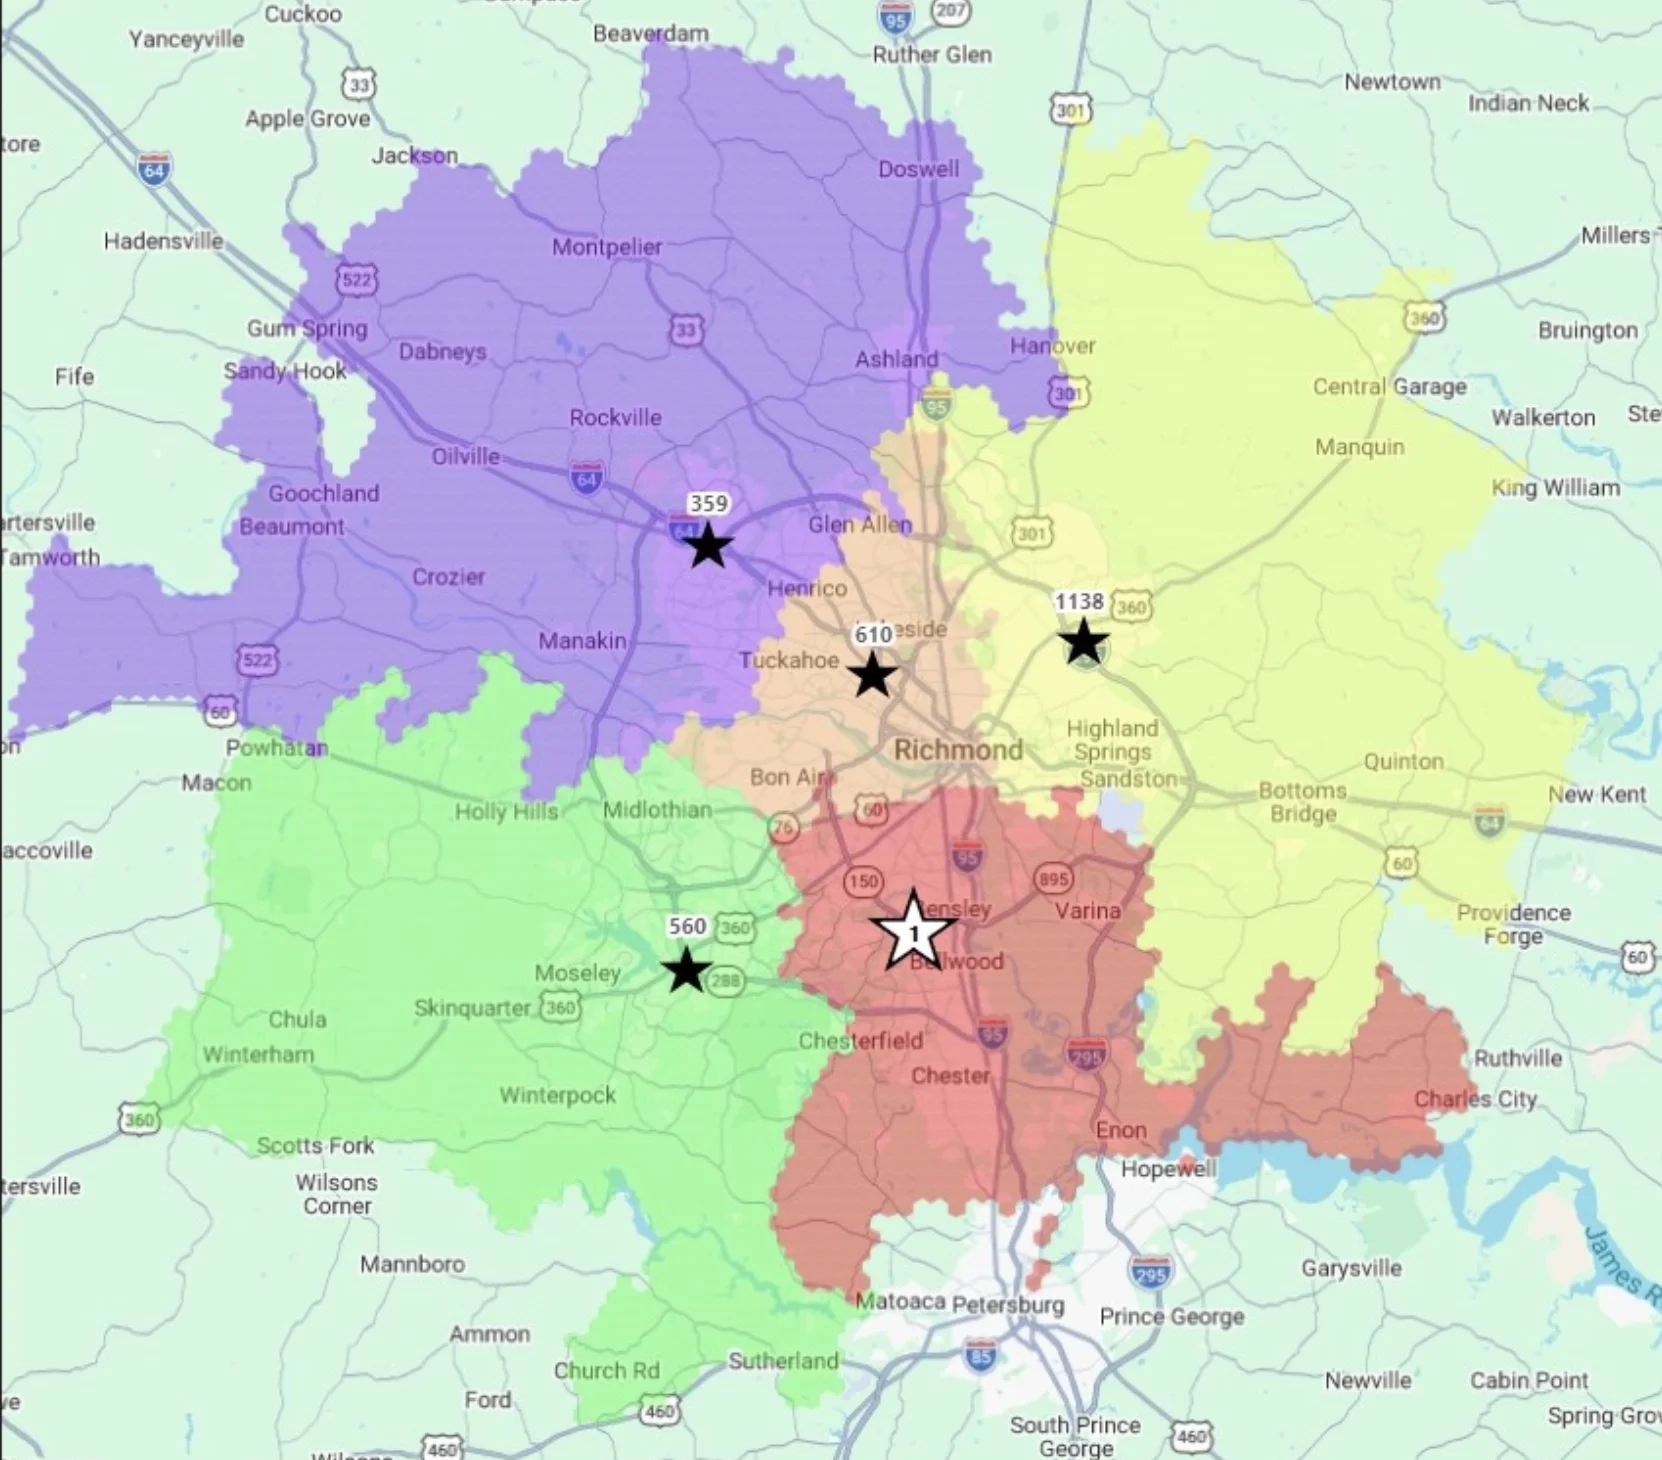
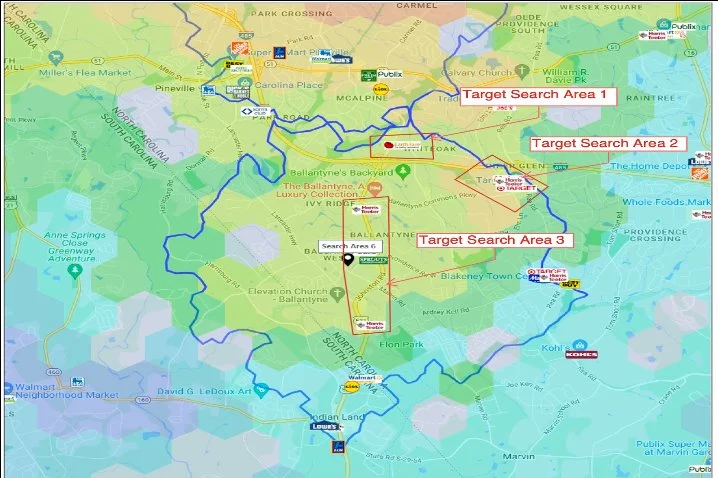
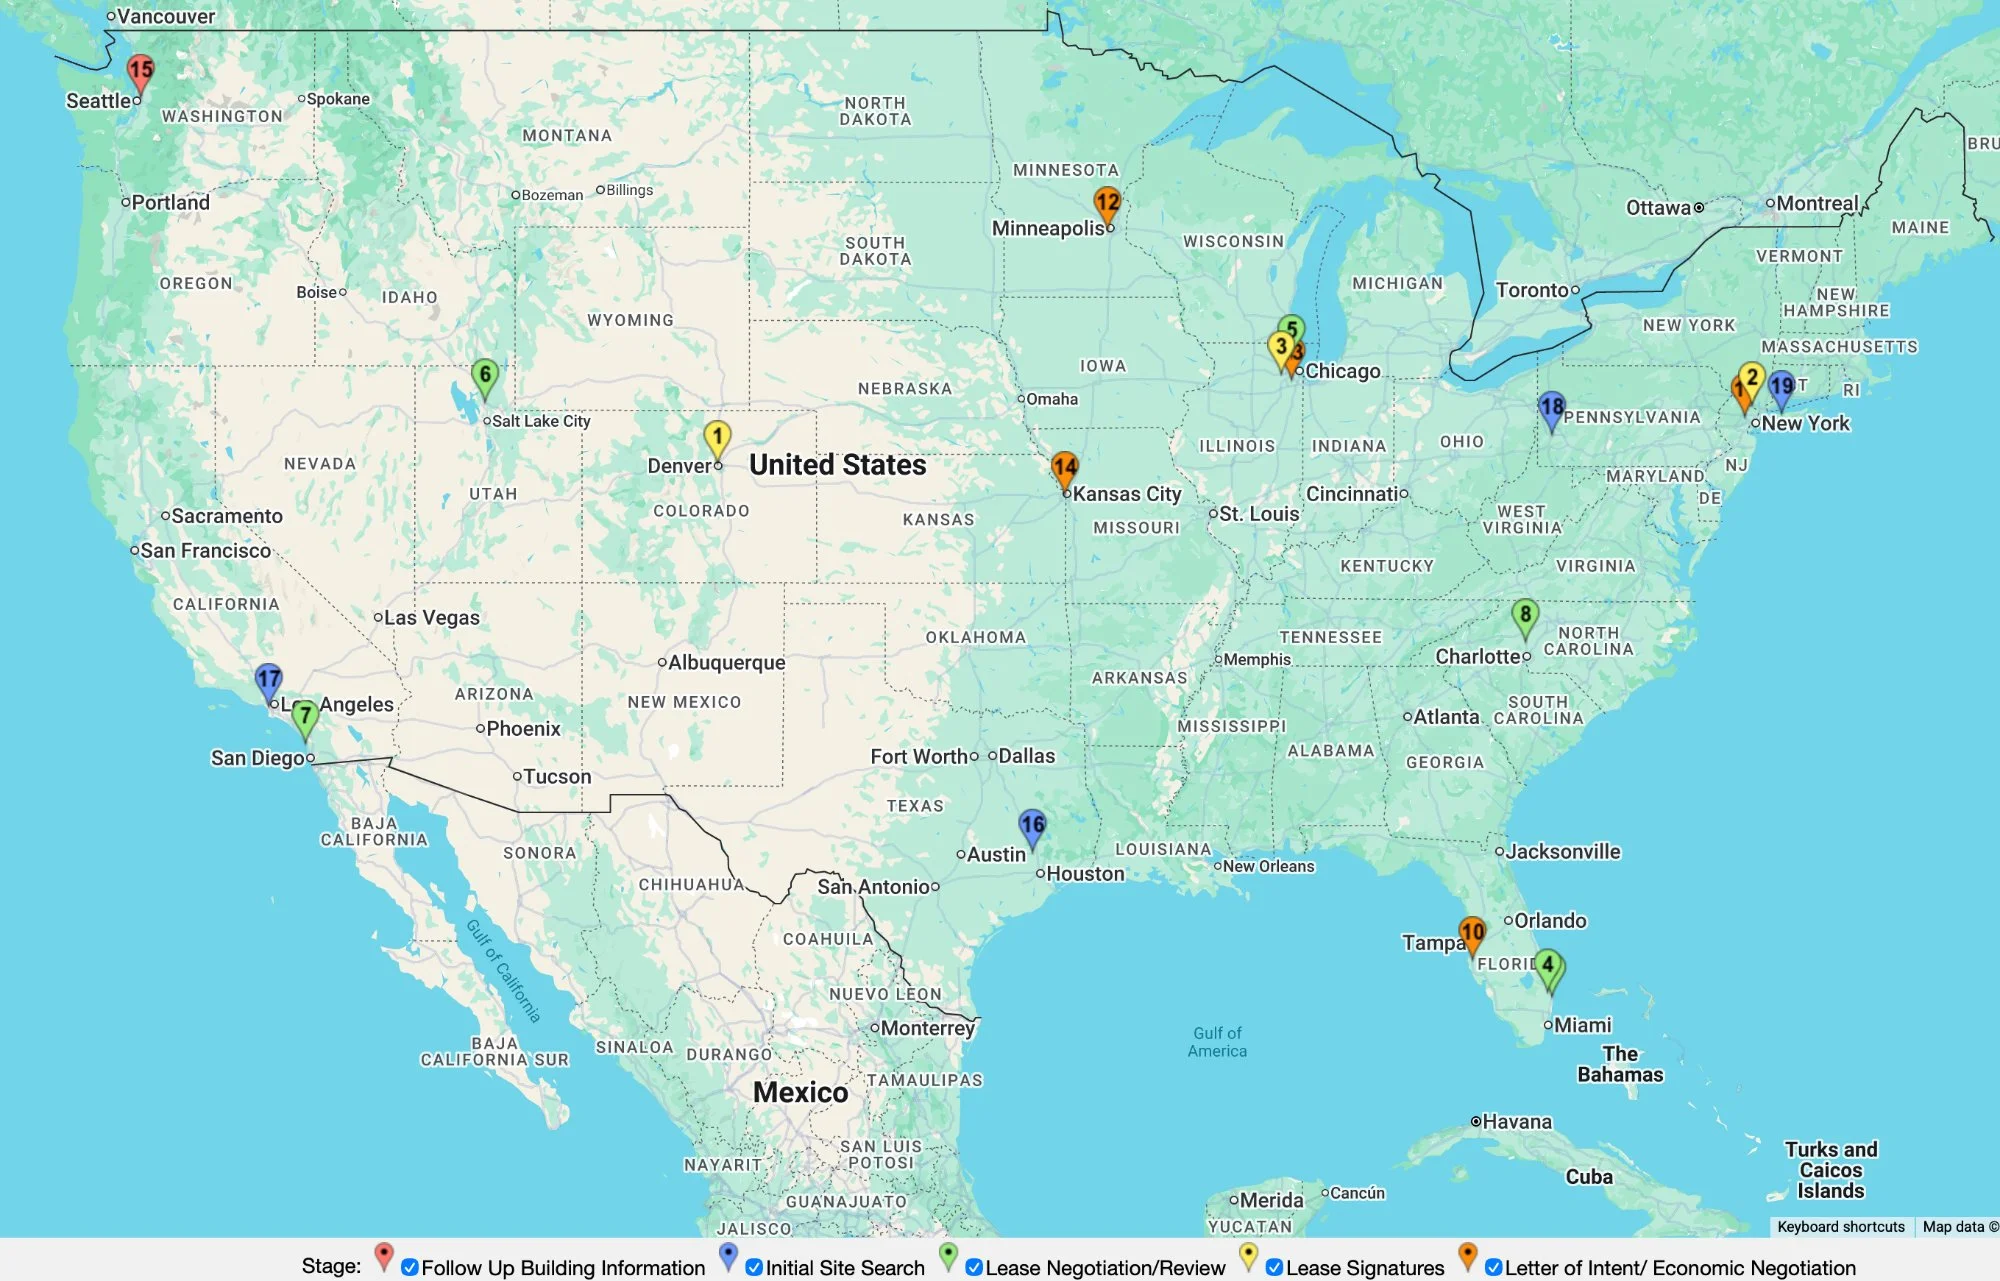
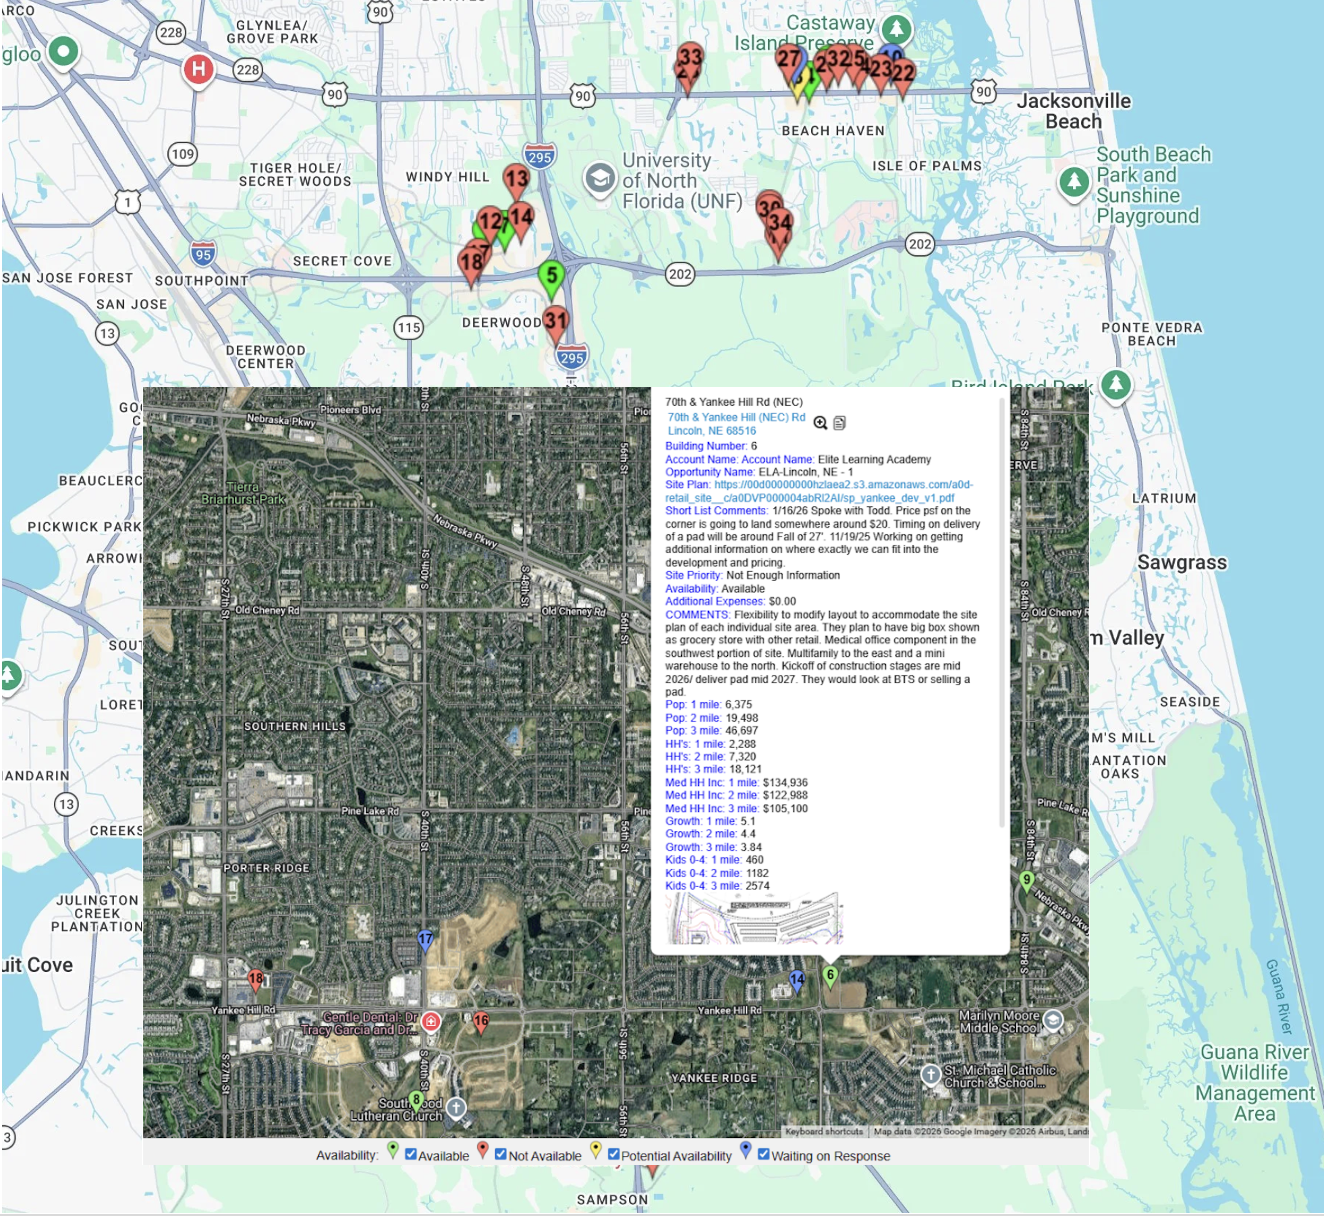
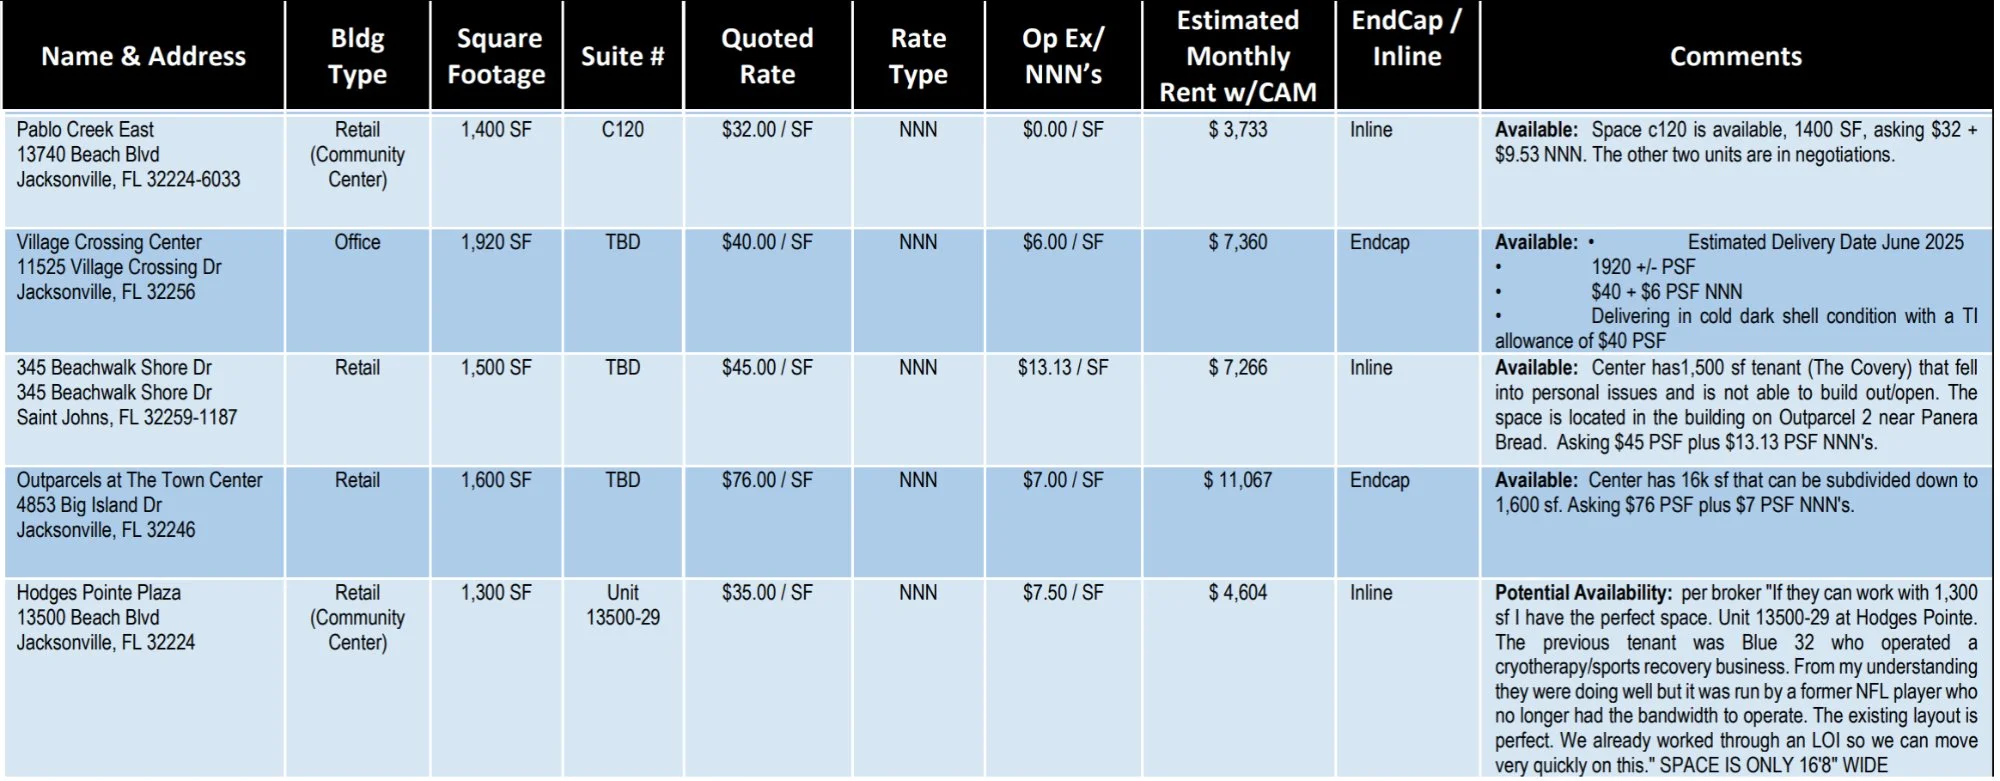
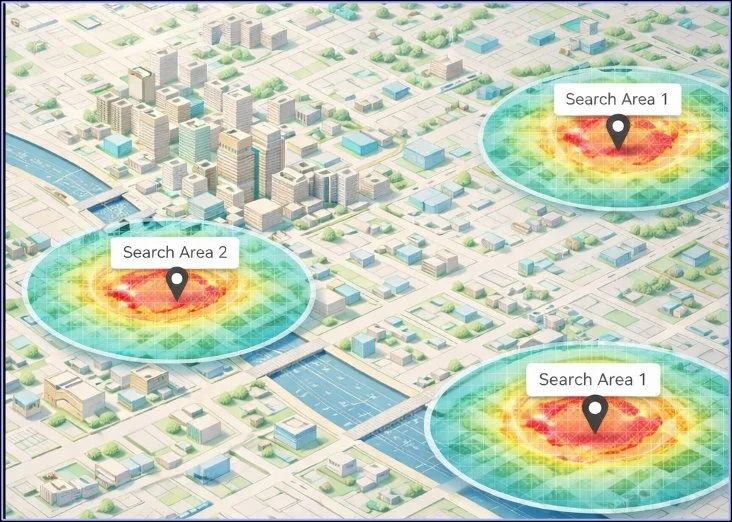
Expansion Should Be Predicted, Not Guessed.

Windsor builds your brand's Location DNA to predict performance — before capital is deployed in the wrong markets and growth turns into drag.

Strategic Results: Higher AUV vs Lower AUV

Replicate the stars. Avoid the dogs.

1

Predictive Model to build your Location DNA

Data analytics to drive every decision

Location Intelligence

We build a detailed customer and market profile with over 2100 inputs

  • Demographic profiles
  • Psychographics
  • Traffic patterns
  • Competitive Analysis
  • Economic indicators

Uncover Location Intelligence where your brand is thriving

Performance Intelligence

We then analyze your current locations to reveal correlations

  • Link operational metrics to site-specific performance
  • Unit Revenue and Profitability
  • Operational Capacity

Uncover Performance Intelligence for your best locations

Location DNA

  • Over 2,100 variables and proprietary algorithms
  • Model your top- and bottom-performing sites
  • Predict the success of new locations with data-backed confidence

Correlate Performance Intelligence to Location Intelligence for growth

Location DNA

Complete analysis of over 2,100 location variables correlated with performance data

Location DNA Circle

Model Correlations (Revenue Intelligence)

Key drivers identified: which location factors most strongly predict success

Revenue Intelligence
2

Territory Optimization

Map high-potential markets that match your Location DNA

Top Performing Territories

We apply your custom predictive model to identify high-potential territories, narrowing your focus to markets that match the DNA of your best-performing locations.

  • Where do you expand?
  • How big is the territory?

Target Search Areas

Create Heat Maps that outline target areas within each Territory with ideal demographic and economic indicators for real estate search areas.

  • How many locations can you support?
  • Where are the hot spots?

Dynamic Territory Strategy

  • Provide a fluid territory mapping system
  • Territories continuously updated as new locations open and thrive
  • Continuously map your ideal "white space" as your locations evolve

Brand Reports

National expansion roadmap

Master Territory Optimization

Comprehensive white space analysis showing all available markets ranked by potential

Master Territory Optimization

Location Reports

Individual territory analysis

MSA Territory Optimization

For each MSA Territory, a dynamic heat map showing the optimum "white space" for new locations (based on the model)

MSA Territory Optimization

Territory Overview with Target Search Areas

Detailed territory analysis with hot spots, demographics, and recommended search zones

Territory Search Areas
3

Precision Site Selection

Score and secure the best locations for optimal performance

Site Search

We perform a comprehensive search in the target zones to find all locations that match your ideal "location DNA". Then we negotiate to see if it can be available.

  • Create a Master Site list (all sites that match your DNA profile)
  • Investigate & call all landlords to inquire and pitch your Brand
  • Determine if they are available (yes/no)

Site Evaluation

We provide clear, prioritized Site Rankings and Comparisons based on your DNA

  • Trade Area Overview per site
  • Demographic Overview per site
  • Real Estate characteristics per site
  • Real Estate economics per site

Site Transaction

End-to-end Strategic Execution

  • Secure the most favorable terms
  • Optimize TI allowances
  • Manage portfolio and renewal options
  • Diligently protect your interests
  • Real-time updating of ongoing activity
  • Managing communications
  • Tracking critical timelines

Brand Reports

Portfolio-wide site evaluation

National Site Selection: Map View

Comparative analysis of all sites under consideration across the portfolio

National Site Selection Map

Location Reports

Detailed site analysis and transaction support

Territory Site Selection: Search Map

Geographic view of all potential sites within target search zones

Site Search Map

Site Selection: Search Results

Master list of all available sites matching your Location DNA profile

Site Search Results

Final Site Evaluation (Short List)

Comprehensive scoring and ranking of top site candidates with detailed analytics

Final Site Evaluation

Terms Summary

Negotiated lease terms comparison across shortlisted properties

Terms Summary

Lease Summary

Final lease documentation and transaction details for executed agreements

Lease Summary

Windsor Way Weekly Reporting

End-to-end process management with transparent, high-quality reporting for both Brand and Franchisees

Complete Process Management

Windsor manages the entire real estate process from initial site search through lease execution, ensuring consistency and quality at every step.

  • Single point of accountability across all phases
  • Coordinated execution for Brand and Franchisees
  • Standardized process ensuring repeatable success

Transparent Status Tracking

Real-time visibility into every active location search with weekly status updates and comprehensive dashboards.

  • Weekly status reports to Brand leadership
  • Individual dashboards for each franchisee/location
  • Clear tracking of progress through each phase

Brand Reports

Portfolio-wide status tracking

Weekly Status Report

Comprehensive overview of all active site searches across the portfolio with progress tracking

Weekly Status Report

Location Reports

Franchisee-specific updates

Weekly Site Selection Dashboard

Individual franchisee dashboard showing current sites under evaluation and next steps

Weekly Site Selection Dashboard

The Windsor Way Strategic Difference: More AUV

Data-driven precision that delivers measurable results

1

We know WHERE to draw the circles

The BEST Territories
Territory Heat Map

Windsor Way Difference:

  • Data driven, not gut feel
  • Highly accurate prediction of performance
  • Aligned with your brand's "Location DNA", not personal preference
  • Ongoing dynamic optimization to minimize cannibalization as you grow
2

We investigate ALL the sites

The RIGHT Site
Site Evaluation

Windsor Way Difference:

  • Investigate all sites that match your Location DNA, not just the "listed" ones
  • Engage the landlords of all sites to understand and score what's available
  • Real-time comprehensive site evaluation
  • Better results than local listing
3

We increase AUV

More Revenue & Profit
Revenue Performance

Windsor Way Difference:

  • Avoid the "dogs", replicate the "stars"
  • Increase location performance and AUV
  • Grow predictably with confidence
  • Reduce risk and protect the brand
  • Attract more quality franchisees
  • Open faster with better results